3D Point Cloud Visualization
Explore high-density 3D point clouds directly in the browser, without specialist desktop software.
Explore every capture in 3D — point clouds, terrain and elevation models, GIS and CAD overlays — with measurement and change-detection tools that turn raw data into answers your teams can act on.
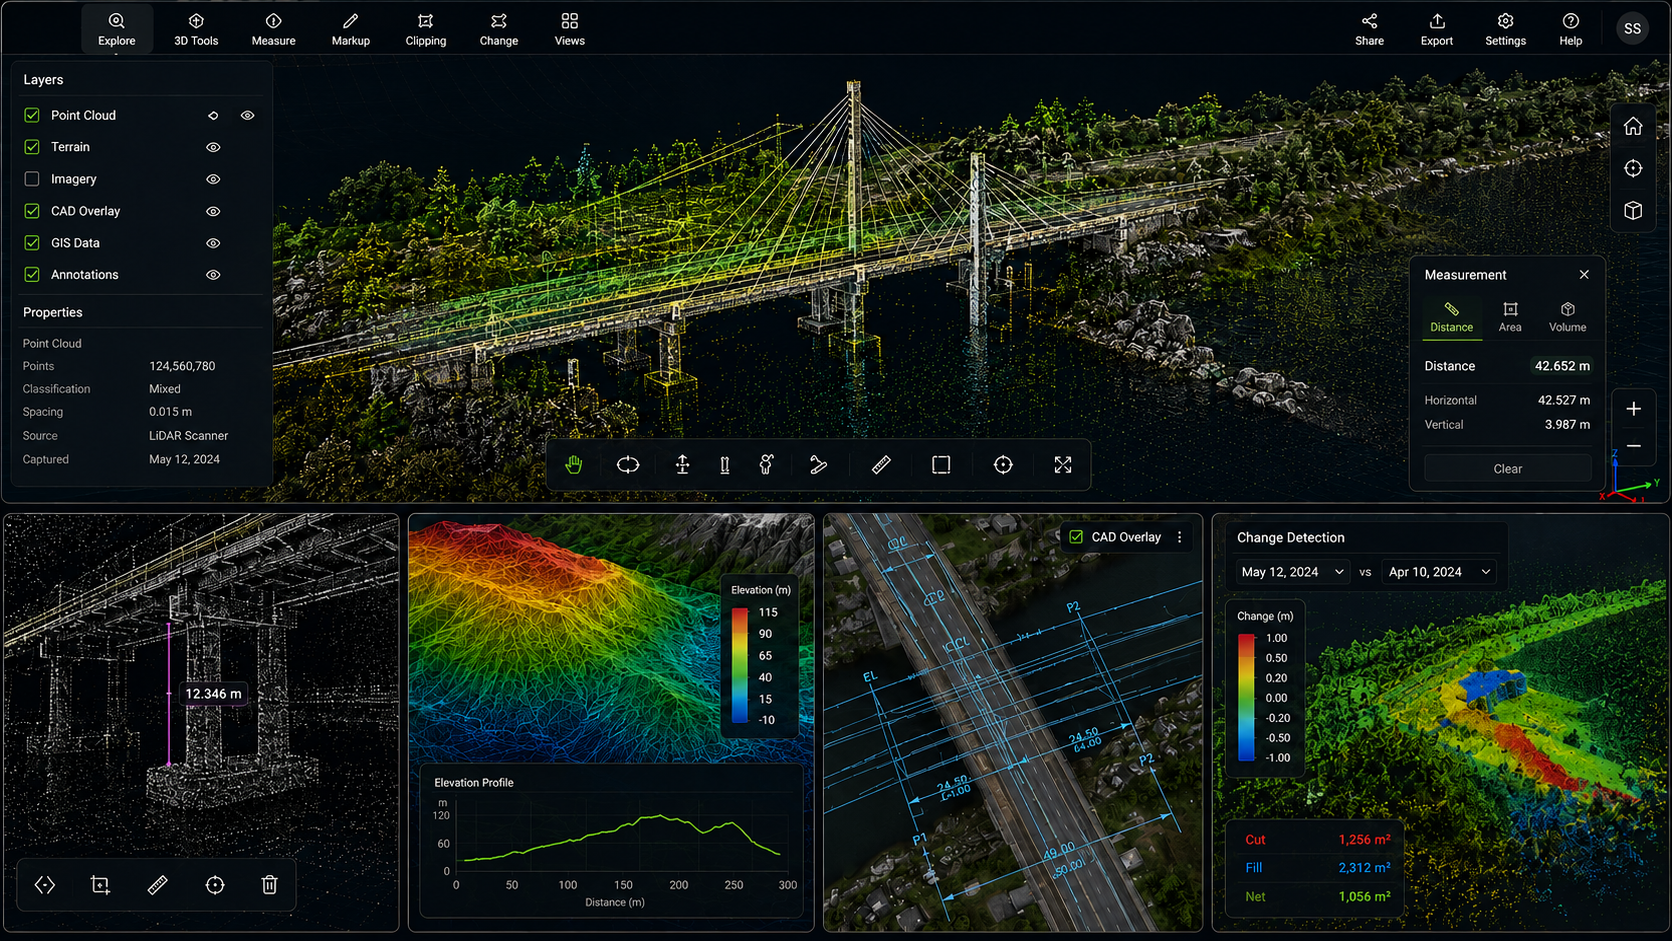
Every dataset can be explored, measured and compared directly in the browser.
Explore high-density 3D point clouds directly in the browser, without specialist desktop software.
Analyse terrain and elevation models to understand grading, drainage, and site conditions.
Overlay GIS and CAD data directly onto your captured point clouds and terrain models for direct comparison.
Take precise measurements and detect change between captures over time, directly within the platform.
Change detection compares captures of the same site over time to highlight what's moved or changed.
Once you've found the answer, share it with the people who need to act on it.
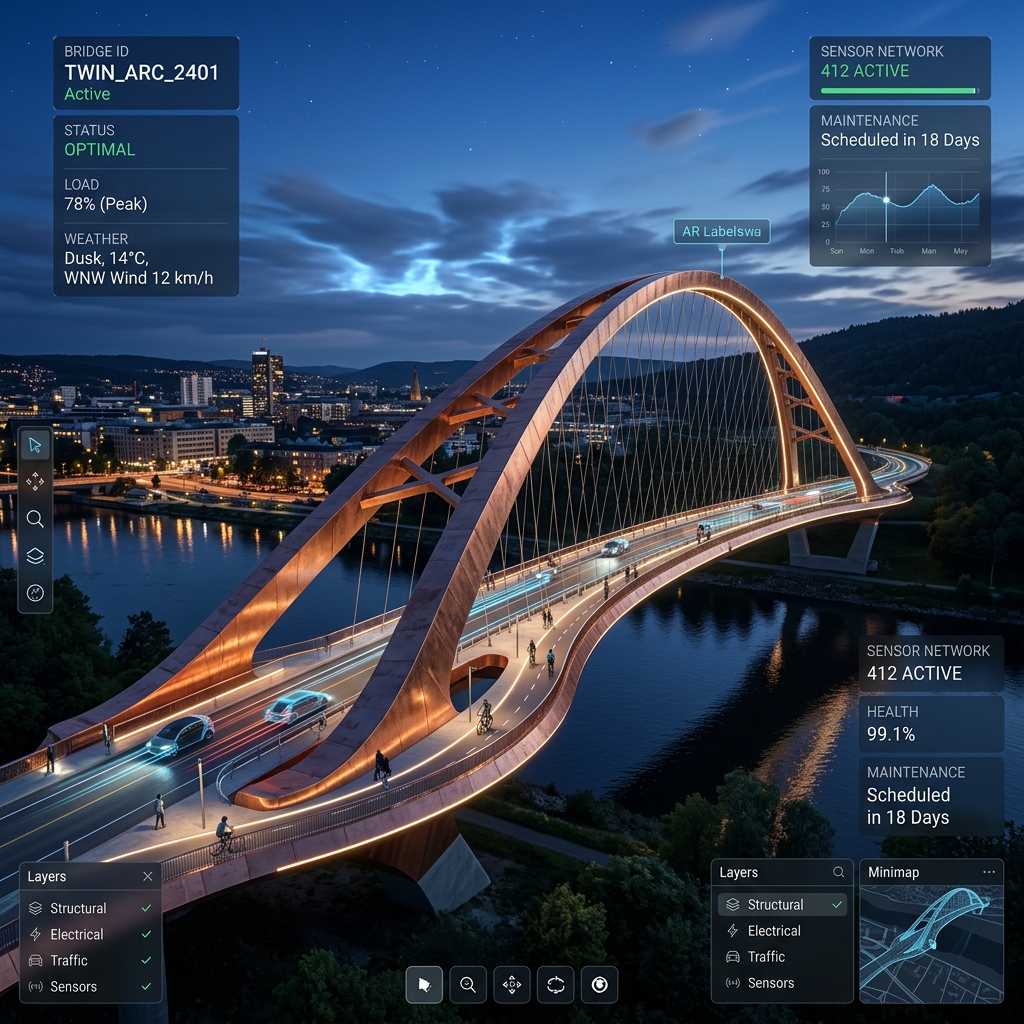
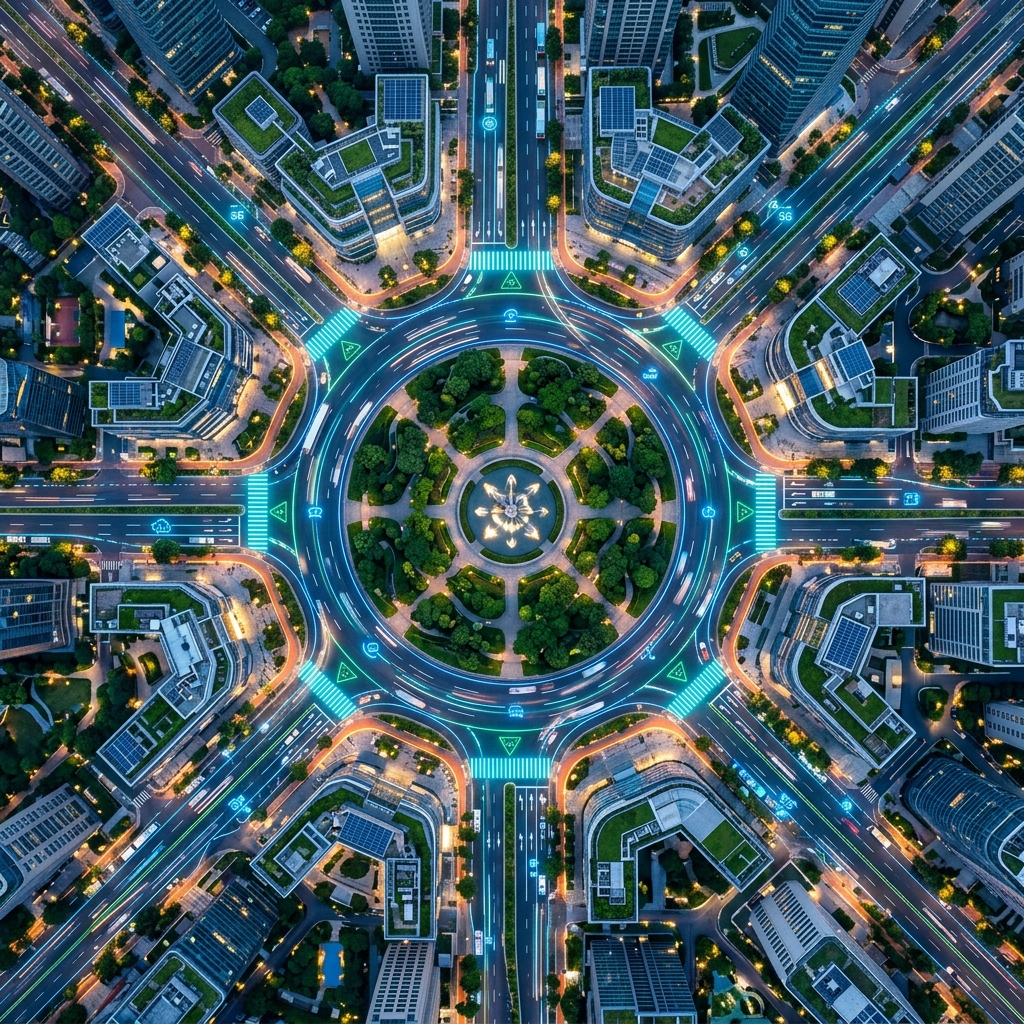
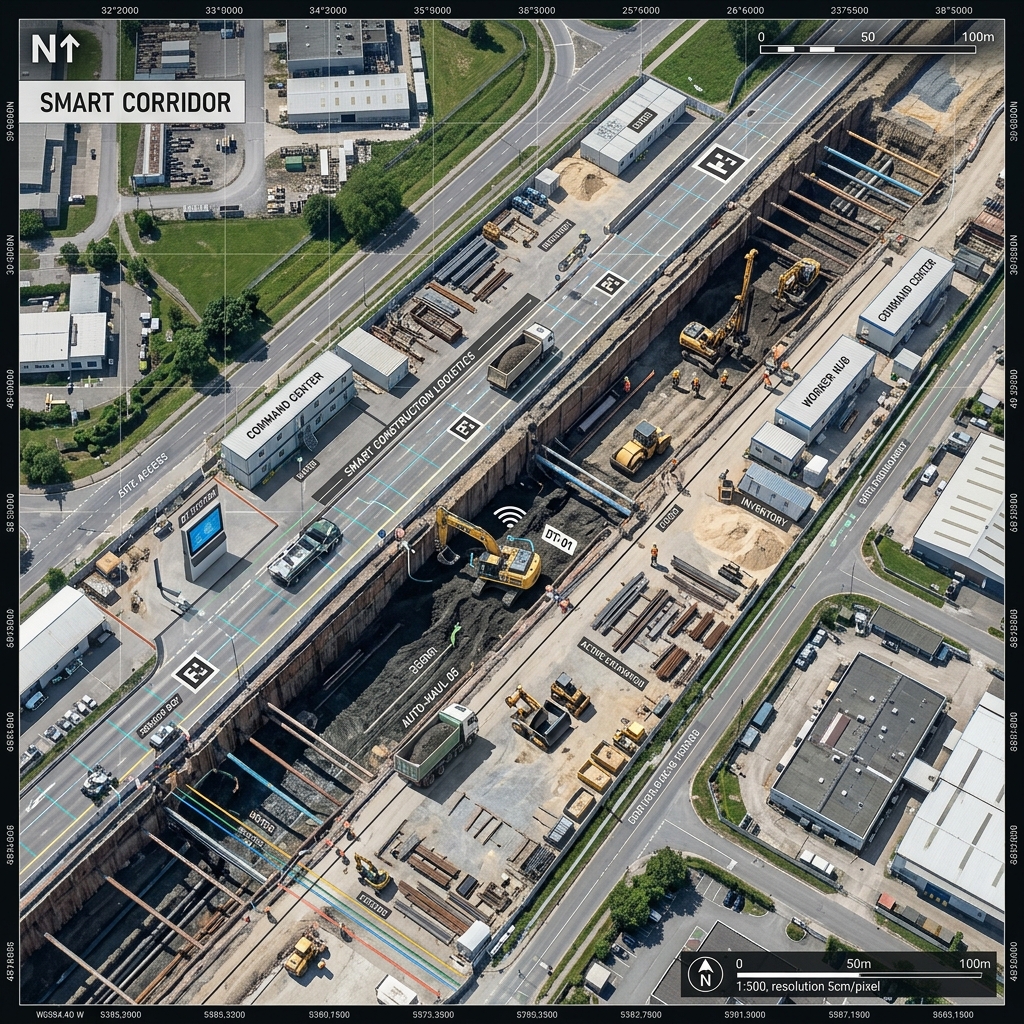
See the Full PipelineA closer look at the kind of captures teams visualise and analyse.
Common questions about how this step works.
No — point clouds are explored directly in the browser through the visualisation platform, without specialist desktop software.
Yes — measurement tools let you take precise measurements directly on point clouds, terrain and elevation models.
Change detection compares captures of the same site taken at different times, highlighting what has moved or changed between them.
Yes — GIS and CAD overlay lets you bring your own data in for direct comparison against the captured point cloud or terrain model.
Share what you've found — the same verified data can be collaborated on and delivered to internal teams, stakeholders and regulators.
Start with a free account, or talk to us about the analysis your project needs.